Canada vs Africa: lakes, islands and a three-to-one gap
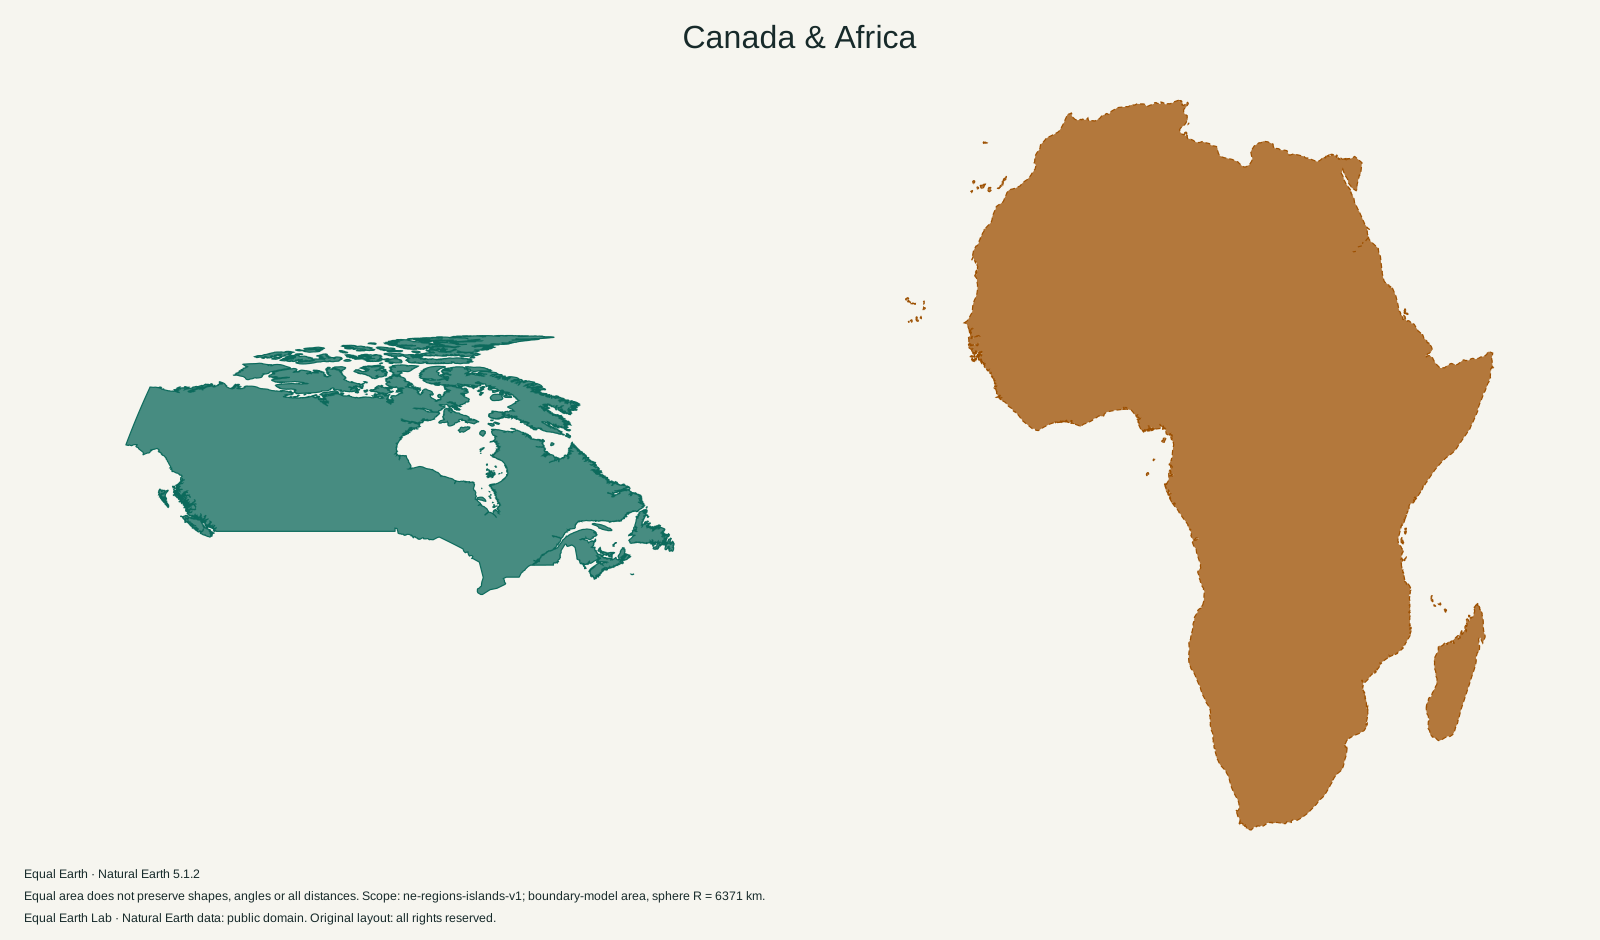
Africa is about three times Canada's area in the map above. Canada's Arctic outline attracts attention, but its freshwater area creates a second, less visible complication when comparing published figures.
Canada is 0.33 times the boundary-model area of Africa.
| Place | Boundary-model area estimate |
|---|---|
| A · Canada | 9,894,474 km² |
| B · Africa | 29,948,465 km² |
Both silhouettes use one shared Equal Earth scale. Moving a silhouette here is a flat cutout comparison; it does not relocate the place on the globe. Shapes still reflect projection distortion. Try spherical relocation
Canada occupies a broad sweep of northern North America. Its mainland surrounds much of Hudson Bay, while an extensive island group continues into the Arctic. A world map can make that reach feel comparable to Africa’s. At a common Equal Earth scale, the filled areas give a different answer: Africa is 3.03 times Canada’s size in this model.
That is a useful estimate to remember. Understanding the figures takes a little more care, because Canada has a large amount of freshwater as well as an intricate coastline.
The missing 891,163 square kilometres
Statistics Canada’s land and freshwater table, published in the 2010 Canada Year Book, gives these national totals:
| Category | Area, km² |
|---|---|
| Land | 9,093,507 |
| Freshwater | 891,163 |
| Land and freshwater together | 9,984,670 |
The difference between the first and last rows is almost nine percent of the combined total. Someone using the land-only figure and someone using land plus freshwater are therefore starting with materially different versions of “Canada’s area.” Both can quote the source correctly.
The boundary-model figure on this page is 9,894,474 km². It retains inland water wherever the source has not cut that water out of the polygons. It is not a replacement for either statistical category. The same calculation is applied to Africa, which makes the silhouettes internally comparable.
For a population-density calculation, this distinction matters. Using a larger area as the denominator produces a lower density for the same population. For a visual comparison, it matters because a plain country silhouette usually hides where lakes have been retained. The area measurement guide explains how to keep the geometry and the statistic consistent.
Follow the gaps between the Arctic islands
Look at the northern edge of the Canadian silhouette. The separate pieces are islands, with sea between them. A rectangle around their outermost points would fill those gaps and exaggerate the area being compared. Hudson Bay presents a similar problem: the mainland curves around a large bay, but enclosing the country in a box makes that water appear to belong to the shape.
Glaciers add another visual layer. Natural Resources Canada describes ice caps and glaciers on Baffin, Bylot and the Queen Elizabeth Islands. The pale areas visible in a physical map can therefore be ice-covered land. They are different from the open gaps between islands. Switching to a solid silhouette helps separate the boundary from the surface colour.
The north of Canada gets more map enlargement than the south
On Mercator, Canada has no single enlargement factor. Its northern islands receive more area inflation than its southern mainland because the projection’s scale increases with latitude. Africa stretches across the equator, so the two outlines receive very different treatment on a Mercator world map.
To see the effect, open Canada on Mercator and switch to Equal Earth without changing the selected country. Concentrate on the Arctic islands first, then on the mainland. The country has not lost territory; the map has changed how much room high-latitude ground receives on screen.
The Africa outline here includes Madagascar and the other mapped islands in the site’s physical-continent definition. Canada includes its mapped islands under the same boundary version. With those choices fixed, moving or overlapping the silhouettes does not change the three-to-one relationship. Changing the definition of area can.
Sources & further reading
Map calculations use the fixed dataset described in our methodology.