Why Greenland looks so big on a world map
Greenland lies far north, where Mercator greatly enlarges map area. Its geographic area does not change when you switch to Equal Earth; its share of the picture does.
Why latitude matters
Mercator places meridians at a constant spacing across the map, although the physical distance between them shrinks toward the poles. To preserve local angles, its north–south scale grows along with its east–west scale. Greenland occupies high latitudes, so both dimensions of its outline are enlarged relative to equatorial land. This follows from the spherical Mercator equations.
An image can therefore make Greenland and Africa seem roughly comparable in size. The exact impression depends on the crop, the chosen projection and the display. It is not a statement about their geographic areas. Africa spans the equator; Greenland lies much closer to the North Pole, where Mercator’s area enlargement is stronger.
How Greenland actually compares with Africa
| Place and scope | Area estimate |
|---|---|
| Africa | 29,948,465 km² |
| Greenland | 2,137,884 km² |
Africa / Greenland: 14.01. The ratio uses unrounded values; the table rounds to the nearest square kilometre.
These figures use the same Natural Earth boundary model and a sphere of radius 6,371 km. Africa is about fourteen times Greenland’s area in that model. Greenland is still a very large island; a corrected proportion does not make it geographically small.
The comparison includes Africa’s regional islands under the site’s continent scope. Greenland is measured as its own territory. These are boundary-model results, with generalized coastlines, rather than official national land-area statistics. The Africa and Greenland comparison shows both outlines at a shared equal-area scale and explains the exact scope.
The enlargement grows quickly near the poles
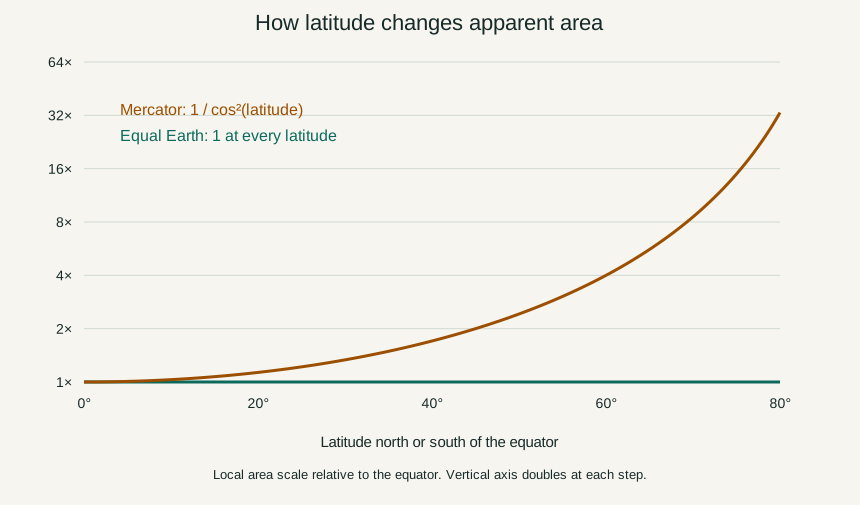
The chart evaluates 1 / cos²(latitude) for Mercator, normalized to its equatorial scale. A tiny patch at 60° occupies four times the map area of an equal geographic patch at the equator. At 80°, the factor is about 33.16. The vertical axis doubles at each step, so the steep rise is substantial even on this compressed scale.
These examples explain the mechanism; they do not provide one exact correction factor for Greenland. The island extends across a range of latitudes. Its northern parts receive more enlargement than its southern parts. Multiplying its total area by the factor at the capital or centroid would treat the entire island as a tiny patch at one location, which it is not.
What Equal Earth changes
Equal Earth preserves relative area across its world map. Greenland therefore occupies about one fourteenth of Africa’s filled area when both use the same drawing scale. Its outline can change shape, especially when placed far from the central meridian. Area preservation does not require the same width, height or orientation as on Mercator.
The projection also displays the poles in a finite frame. Mercator cannot show either pole at a finite vertical coordinate; this site’s Mercator view stops at about 85.05° north and south. That crop is a display limit, not the coastline of a polar continent or a limit to how far the Earth extends.
Try moving the same outline
Select Greenland on the world map, then use the comparison action in its details. Drag the copy toward the equator while Mercator is selected. The copied geometry rotates on the sphere; it is not resized with a simple screen transform. Watch the outline’s apparent area change even though its geographic area is fixed.
Now switch to Equal Earth. The copy still changes shape as its position changes, but its filled map area stays the same away from the map’s cut, within drawing precision. At the cut, one continuous geographic feature may be displayed in two pieces.
This experiment answers a specific question about projection distortion. It does not simulate moving a population or predict climate. A region’s latitude affects many things in the real world; here only its geometry is being repositioned.
Sources & further reading
Map calculations use the fixed dataset described in our methodology.