Japan vs Germany: close in area, far apart in shape
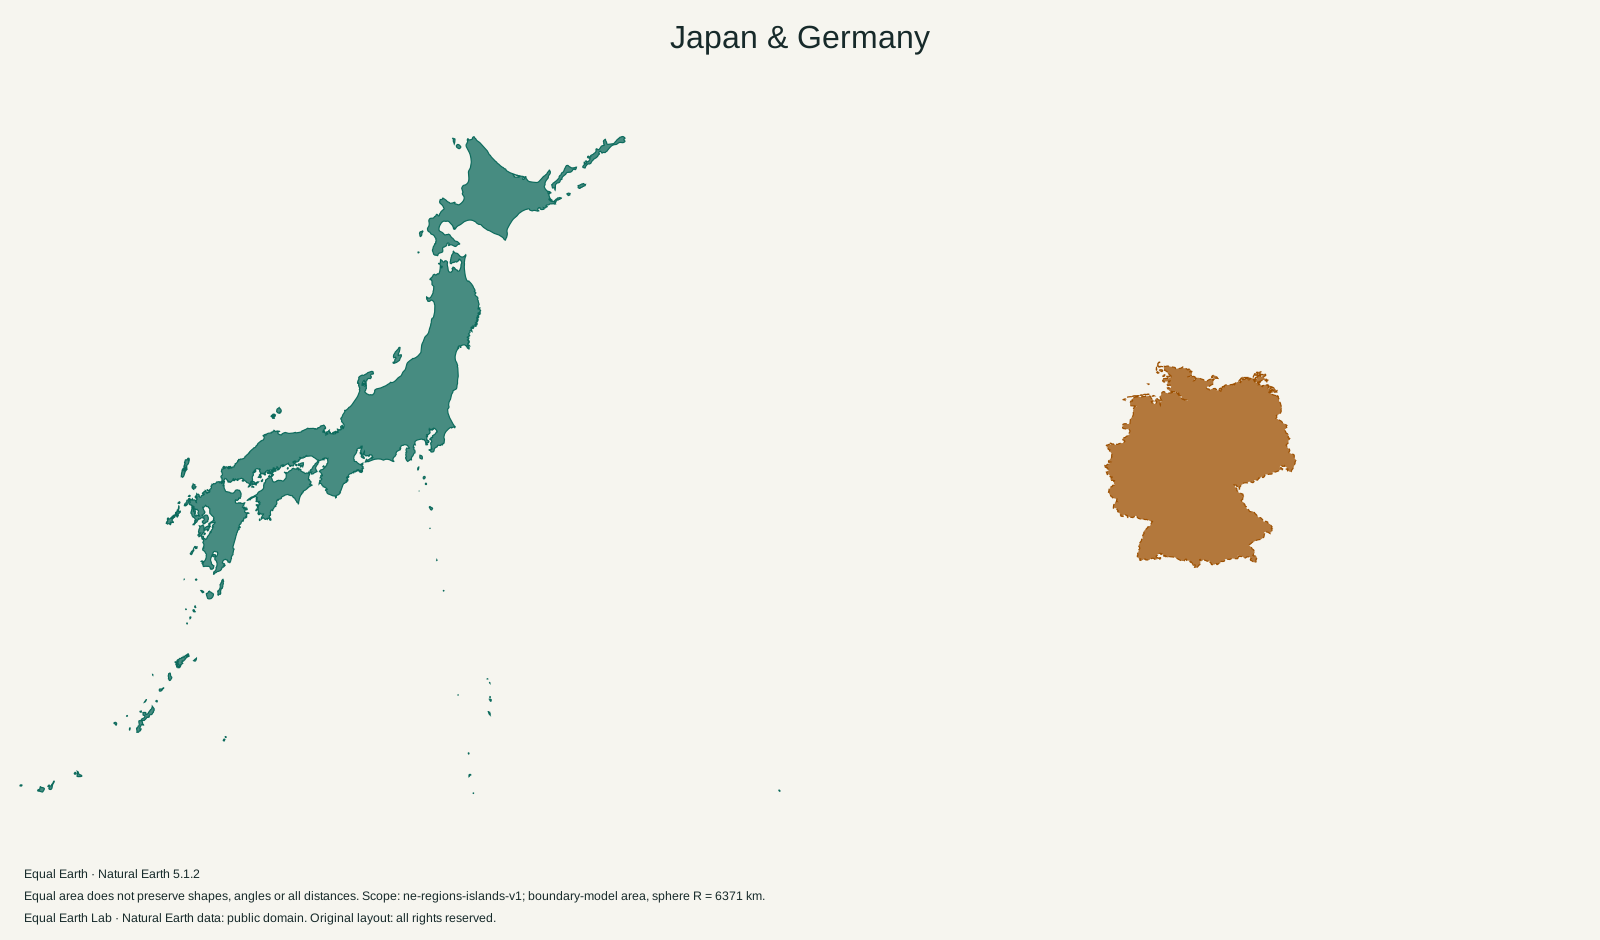
Japan is about six percent larger than Germany in our boundary model. Their silhouettes look much less alike than that small difference suggests: Japan follows a long island arc, while Germany has a more compact outline.
Japan is 1.06 times the boundary-model area of Germany.
| Place | Boundary-model area estimate |
|---|---|
| A · Japan | 378,248 km² |
| B · Germany | 356,378 km² |
Both silhouettes use one shared Equal Earth scale. Moving a silhouette here is a flat cutout comparison; it does not relocate the place on the globe. Shapes still reflect projection distortion. Try spherical relocation
Japan covers 378,248 km² in the map above; Germany covers 356,378 km². The difference is only about 22,000 square kilometres in this model. Japan is 1.06 times Germany’s size, so these are countries of broadly similar area.
That is easy to miss if their maps appear in separate boxes. A long island chain and a compact mainland outline need very different amounts of space around them. Resizing each to fill the same thumbnail can make their relationship almost arbitrary.
Follow Japan’s curve, then Germany’s interior
Japan’s outline bends from Hokkaido in the northeast through Honshu, with Shikoku and Kyushu to the southwest. Smaller islands extend beyond those familiar main pieces. The result is a country whose overall length includes substantial stretches of sea between land areas.
Germany’s outline gives the eye more continuous ground to follow. Moving inward from its border generally brings you farther into the same main polygon. On Japan’s outline, a movement of the same length may cross a coast or a strait. The contrast explains why a similar area does not imply a similar national shape.
Try overlapping the outlines above. Parts of Germany extend beyond Japan while parts of Japan extend beyond Germany. This is expected. A slightly larger total area does not guarantee that one shape can contain the other, just as a long strip of paper can have more area than a square while remaining much narrower.
The same amount of ground can have very different relief
Japan’s Statistical Bureau describes a country in which mountains and hilly terrain account for about three quarters of the surface. Its Statistical Handbook of Japan 2025 also explains the archipelago’s exposure to earthquakes and volcanic activity. Those facts help explain why an area figure alone gives an incomplete picture of the country.
Germany has a different north-to-south terrain pattern: broad northern plains, central uplands and the Alps at its southern edge. The geographic overview on Deutschland.de describes that progression. A similar national area therefore sits within a different arrangement of low ground, mountain ranges and coastlines.
Use the physical basemap to inspect the contrast. Open Japan, then select Germany. Look for continuous mountain belts and for the wider lowland areas between them. The shaded relief supplies information that a solid silhouette intentionally leaves out.
Neither map view measures the area of slopes as though a sheet had been draped over every mountain. The numbers describe the country’s footprint on the site’s spherical model. They also do not measure how much land is suitable for housing or farming. Those questions require land-use and terrain data beyond national boundaries.
Germany’s latitude adds a separate visual bias
Germany lies farther north than Japan’s main islands. On Mercator, higher latitude gives a small patch more apparent area. That means a Mercator world map can make Germany look disproportionately large relative to Japan, even before the two maps are fitted into separate panels. The Mercator reference explains why this projection expands area toward the poles.
The shared Equal Earth scale above removes that area bias. Japan remains only a little larger. Both outlines include the islands represented in the fixed Natural Earth boundary version; national statistical products can report somewhat different totals because of their own boundaries, dates and measurement methods.
For a second reference point, compare Japan with the United Kingdom. Japan’s area stays the same, while the other country’s island geography makes for a different comparison.
Sources & further reading
Map calculations use the fixed dataset described in our methodology.