Equal Earth vs Mercator: area, angles and the shape of the world
Equal Earth keeps geographic areas in proportion. Mercator keeps local angles while enlarging high latitudes. Their differences affect country comparisons, navigation, thematic maps and even the meaning of a straight line.
| Property | Equal Earth | Mercator |
|---|---|---|
| Preserves geographic area ratios | Yes | No; relative area increases toward the poles |
| Preserves local angles | No | Yes, on the surface model for which it is defined |
| Graticule | Straight parallels, mostly curved meridians | Straight parallels and meridians intersecting at right angles |
| Poles | Finite boundary lines | Cannot be shown at a finite distance |
| Constant-bearing routes | Generally curved | Straight |
| Strong use case | World maps about relative geographic extent | Local-angle and constant-bearing tasks |
The difference that changes country sizes
On Equal Earth, Africa and Greenland retain their geographic area ratio. On Mercator, Greenland’s high latitudes enlarge its appearance relative to land near the equator. No border or geographic area has to change for the two displays to look dramatically different. Equal Earth’s area property and Mercator’s local angle property explain the tradeoff.
Compare projections on the world mapOn the world map, the selected place and central meridian remain available as you switch projections. Each projection fits its world independently, so pixels across the views do not imply a common map scale. For numeric area comparisons, use the shared-scale country comparisons.
Why Greenland grows on Mercator
On a globe, meridians converge as they approach a pole. Mercator spreads them into parallel vertical lines. To preserve local angles while stretching east–west distances, it must stretch north–south distances by the same local factor. The result is an increase in both dimensions, and therefore a still larger increase in displayed area.
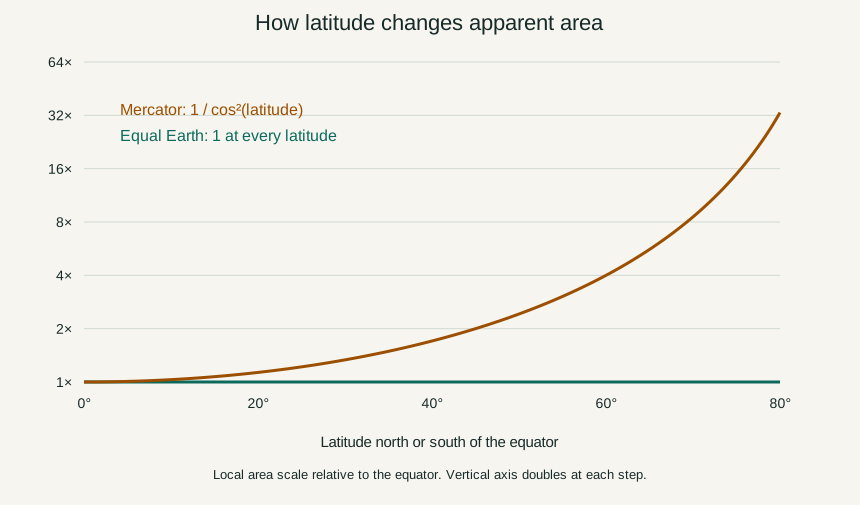
For the spherical Mercator used here, the local linear factor relative to the
equator is 1 / cos(latitude). The local area factor is its square. At 60°, a
small patch takes four times the area of an equal patch at the equator. At 80°,
that factor is about 33.16. These are local factors: a large country spans a range
of latitudes and cannot be assigned the scale at its capital or centre as though
that value applied everywhere.
Equal Earth balances stretching in one direction with compression in another. Its small patches change shape, but their areas remain proportional to their spherical areas. This is why the Africa–Greenland comparison retains its roughly fourteen-to-one area ratio on Equal Earth. The coastlines and the numerical ratio come from the same prepared boundary model; the projection does not create a new definition of either region.
| Latitude | Equal Earth | Mercator |
|---|---|---|
| 0° | 1.00× | 1.00× |
| 30° | 1.00× | 1.33× |
| 45° | 1.00× | 2.00× |
| 60° | 1.00× | 4.00× |
| 75° | 1.00× | 14.93× |
| 80° | 1.00× | 33.16× |
Calculated on a sphere at the central meridian using the site’s projection functions. These describe tiny patches, not average distortion across an entire country. Robinson values depend slightly on the interpolation used.
At 75°, for example, a tiny patch occupies about 14.93 times the projected area of an equal patch at the equator. That does not mean every country touching 75° is enlarged by 14.93 times. It also does not mean that a square centimetre on one of the independently fitted diagrams can be compared directly with a square centimetre in the other.
The mathematical reason for the difference
Let λ be longitude from the central meridian, φ latitude and R the sphere’s
radius. In radians, the equator-normalized spherical Mercator equations are:
x = R λ
y = R ln tan(π/4 + φ/2)
These are the spherical equations documented by PROJ.
Differentiating gives ∂x/∂λ = R and ∂y/∂φ = R / cos φ. On the globe, however,
the area of a tiny longitude–latitude patch is R² cos φ dλ dφ. Dividing the
projected area by that spherical area gives:
Mercator local area factor
  = [R × R / cos φ] / [R² cos φ]
  = 1 / cos² φ
Equal Earth’s equations are more involved, but their determinant is exactly
R² cos φ. Dividing by the same spherical area factor leaves a constant one.
The full Equal Earth derivation
shows how the horizontal and vertical terms cancel. Area preservation comes from
this relationship across the surface, rather than from manually resizing a few
familiar countries.
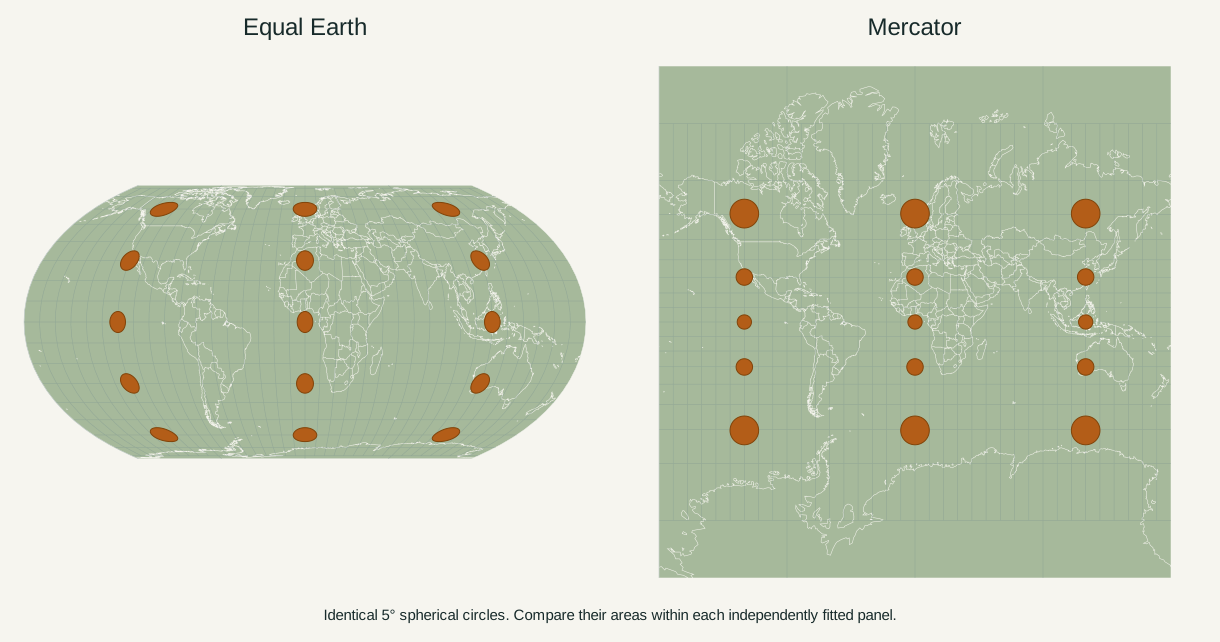
The two guarantees concern different measurements. Mercator’s equal local stretching in all directions preserves angles. Equal Earth’s product of local stretches preserves area, while the stretches themselves can differ. A small circle therefore stays approximately circular on Mercator and becomes an ellipse on Equal Earth. A finite five-degree circle, like those in the first figure, is only a visual approximation to this infinitesimal argument.
Choose by the claim you want to make
Choose Equal Earth for a world map about land-area proportions. Choose Mercator to demonstrate local angles, compass bearings or the latitude distortion familiar from many web maps. Neither projection gives universally correct distances. A straight route on Mercator follows a constant bearing; it is not generally a shortest route.
Both maps here use the same spherical model and Natural Earth boundary version. Mercator omits latitudes beyond approximately 85.0511°; Equal Earth includes the poles. Turning either map south-up changes its orientation, not these properties.
What each map leaves you unable to measure
Equal-area does not mean equal-distance. A ruler across an Equal Earth world map cannot give reliable distances for arbitrary routes, and a coastline’s shape can change substantially near the edge. Mercator’s preservation of local angles does not make an entire continent look like a globe viewed from space. Conformality is a local property, and the scale still varies from place to place.
The distinction also matters in thematic maps. For a map about the extent of forest or farmland, Equal Earth avoids granting northern regions extra visual area simply because of their latitude. It cannot correct missing observations, misleading colour classes or an inappropriate comparison of totals with rates. The projection and the statistical design both affect the conclusion a reader can reasonably draw.
If you need a complete world outline on one finite page, Equal Earth supplies one. Mercator requires a latitude cutoff because its poles lie infinitely far away. A clipped Antarctic outline therefore does not mean that the source data contains less Antarctic land; it reflects what the display can include.
Why the Mercator map stops at about 85°
Mercator has no natural rectangular top edge. As latitude approaches 90°, its
vertical coordinate grows without bound. This site uses the conventional square
world extent: longitude runs from −π to π, and the north and south edges
have projected vertical coordinates ±π R.
Inverting Mercator at that edge gives φ = atan(sinh π), approximately
85.0511288°. The cutoff makes a finite square, but leaves small polar caps outside
the display. Equal Earth includes the whole globe within its rounded frame.
Neither choice makes its polar shapes suitable for detailed polar geography;
that is a separate map-design task.
Mercator and Web Mercator are not identical claims
The familiar rectangular appearance of online maps is often associated with Web Mercator, commonly identified as EPSG:3857. PROJ distinguishes that variant from a true ellipsoidal Mercator: Web Mercator applies spherical equations using the ellipsoid’s semimajor axis. Its relationship to local angles on an ellipsoid is therefore different from Mercator’s exact conformal relationship to its chosen surface.
The comparisons on this page consistently use a sphere. Our numerical table and formulas describe that model, and the two map panels use the same geographic data. This keeps the projection experiment separate from differences in Earth models, source boundaries or map services.
Which should you choose?
| Your task | A useful choice | What to check before using the result |
|---|---|---|
| Compare the geographic sizes of countries | Equal Earth | Use matching boundary scopes and a common display scale for separate silhouettes |
| Present global forest or agricultural extent | Equal Earth | Distinguish totals from rates and explain missing observations |
| Explain constant-bearing routes | Mercator | A straight rhumb line is generally not the shortest path |
| Explain projection distortion to readers | Show both | Keep data, orientation and map centre consistent; disclose independent fitting |
| Measure an arbitrary long-distance route | Neither by using a ruler on the page | Calculate the route on an appropriate spherical or ellipsoidal model |
For a less dramatic comparison, Equal Earth vs Robinson shows two similarly rounded world maps with different area behavior. It is useful when Mercator’s obvious polar enlargement makes the choice seem easier than it really is.
Check the idea yourself
Select Greenland on the world map, choose Mercator and create a comparison copy. Move the copy from the equator toward 60°. Its spherical area remains unchanged while its appearance on Mercator grows. Switch to Equal Earth to see area preservation with changing shape.
Repeat with a place that spans a broad latitude range, such as Russia. Watch the whole outline rather than assigning the scale of one point to the entire country. Changing the central meridian can move the cut away from a feature, but does not remove either projection’s intrinsic distortion.
To keep a result, open the map maker and choose the presentation comparison template. Its panels fit independently for a readable layout. Use the numeric country comparisons when your conclusion depends on an area ratio, and retain that explanation when placing a map in a slide or article.
Sources & further reading
- Equal Earth — PROJ documentation
- Mercator — PROJ documentation
- proj.org
- equal-earth.com
- Spherical math — d3-geo
Map calculations use the fixed dataset described in our methodology.